
Precision-Recall Curve for Classification model analysis
Accuracy is something which gives an intuition of model performance. i.e. ratio of number of correct predictions with respect to total sample present. But what in case of unbalanced data.
Imagine a case where we need to make a model to predict click through rate over a display rate. The click trough rate used to be very less around 1 in a 1000 or 1 in a 10000. Now the data we can use is having false dominance which may lead to bias situation. It can take us to an accuracy level of 99.99% of a model but that is having no meaning. So for class imbalanced data we try to separate different kinds of errors.
We can summarise or model performance into 2*2 Confusion matrix
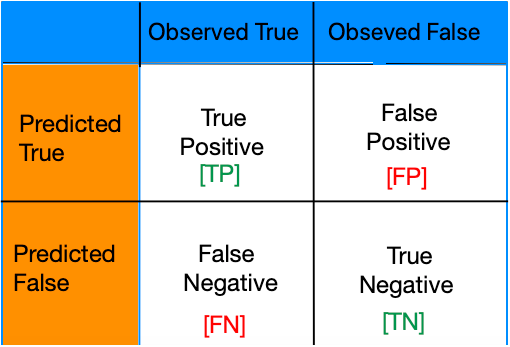
True Positives: – A model correctly predicts a positive class. For example: – Correct test report for a Covid infect person. Treatment started early and get cured.
False Positives: – Error – report of Non-Infected person is positive.
False Negatives: – Error – Report of Infected person is negative and he couldn’t survived
True Negatives: – A model correctly predicts a negative class. Foe example: – Test report of non-infected person is negative and he is happy.
Evaluation Metrics: Precision & Recall
Precision = True Positive / All Positive Predictions
How Precise a model is i.e. when a model said positive is it right?
Recall = True Positive / All actual Positive
How model needs to recall is i.e. out of all the possible positives, How many model identified correctly?
Let’s Consider a case study: –
Let’s consider a set of 100 tumours classified as malignant(positive class) or benign(negative class).
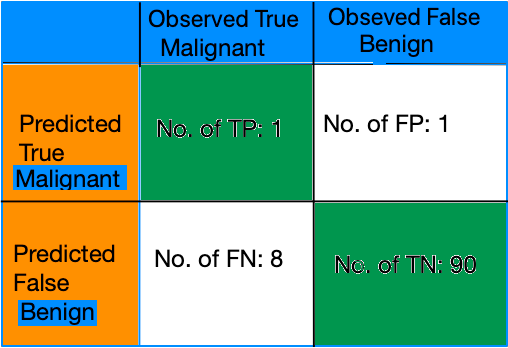
Accuracy in this case = (TP + TN) / (TP+FP+FN+TN) = (1+90) / (1+1+8+90) = 0.91
91% accuracy shows our model is performing great on first impression. But it needs a closer analysis of positive and negative classes to gain more insights.
We are having 91 benign and 9 malignant out of 100 samples. On begin side model predicted 90 out of 91 correctly but on Malignant side it is terrible with 8 out of 9 predictions are incorrect.
So we can say accuracy alone can’y give us the correct picture of a model created using imbalanced data.
Now let’s see two metrics for evaluating imbalanced class problem: – Precision and Recall
Precision = TP / (TP+FP) = 1/(1+1) = 0.5
So precision is 0.5 which means when it is predicting Malignant it is 50% of the time correct.
Recall = TP / (TP+FN) = 1/(1+8) = 1/9 = 0.11
It means it correctly identified 11% of malignant tumours.
Now Precision and Recall is actually a tug of War
To examine a model we need to examine both and maintain a balanced condition. Its like increasing the Precision will reduce Recall and Vice Versa.
Let’s consider a case with email classification. You are having 30 mail to be classified as spam(positive) or not-spam(negative)
Case 1:- Following figure shows the predictive division between two classes.
![Confusion-matrix [precision recall]](http://aieagle.in/wp-content/uploads/2020/10/Screenshot-2020-10-15-at-1.20.22-PM.png)
Now Precision will tell the percentage of correct spam prediction out of all spam prediction.
Precision = TP/(TP+FP) = 8/(8+2) = 8/10 = 0.8
Recall will tell out of all actual spam what’s percentage of spam predicted correct
Recall = TP/(TP+FN) = 8/(8+3) = 0.73
Case 2: – Increase Classification Threshold
Increase in threshold value for classification decreases the false positive but increase false negative.
![Precision Recall [Confusion Matrix]](http://aieagle.in/wp-content/uploads/2020/10/Screenshot-2020-10-15-at-1.22.12-PM.png)
Now Precision will get increased.
Precision = TP/(TP+FP) = 7/(7+1) = 7/8 = 0.88
And the recall will get decreased
Recall = TP/(TP+FN) = 7/(7+4) = 0.64
Case 3: – Decrease Classification Threshold
Decrease in threshold value for classification increases the false positive but decreases false negative.
![Precision Recall [Confusion Matrix]](http://aieagle.in/wp-content/uploads/2020/10/Screenshot-2020-10-15-at-1.22.22-PM.png)
So, Precision will get decreased.
Precision = TP/(TP+FP) = 9/(9+3) = 9/12 = 0.75
And the recall will get increased
Recall = TP/(TP+FN) = 9/(9+2) = 0.82
These things are often in little tension. You can understand it like this if you want model to be better at recall, your model needs to be more aggressive. It means with just common simple symptoms one is reported positive. So you think of that is lowering the classification threshold.
But at the same time you need to be precise, the right thing for your model is to predict someone is positive when it is absolutely sure. So you can think of raising the classification threshold.
So these two metrics are often in tension and it is important that both of them should perform well. So to define the goodness of a model you need to tell about recall value as well if precision is asked.
So, it’s the hunt of better classification threshold which can make our classification based model good in predicting. The general idea is evaluating your model across different classification threshold value.
Precision Recall using Python
# pr curve for logistic regression model
from sklearn.datasets import make_classification
from sklearn.linear_model import LogisticRegression
from sklearn.model_selection import train_test_split
from sklearn.metrics import precision_recall_curve
from matplotlib import pyplot
from numpy import argmax
# generate dataset
X, y = make_classification(n_samples=500, n_classes=2, random_state=1)
# split into train/test sets
trainX, testX, trainy, testy = train_test_split(X, y, test_size=0.5, random_state=2, stratify=y)

# fit a model
model = LogisticRegression()
model.fit(trainX, trainy)
# predict probabilities
yhat = model.predict_proba(testX)

# keep probabilities for the positive outcome only
yhat = yhat[:, 1]
# calculate pr-curve
precision, recall, thresholds = precision_recall_curve(testy, yhat)
# plot the roc curve for the model
no_skill = len(testy[testy==1]) / len(testy)
pyplot.figure(figsize=(12,8))
pyplot.plot([0,1], [no_skill,no_skill], linestyle='--', label='No Skill')
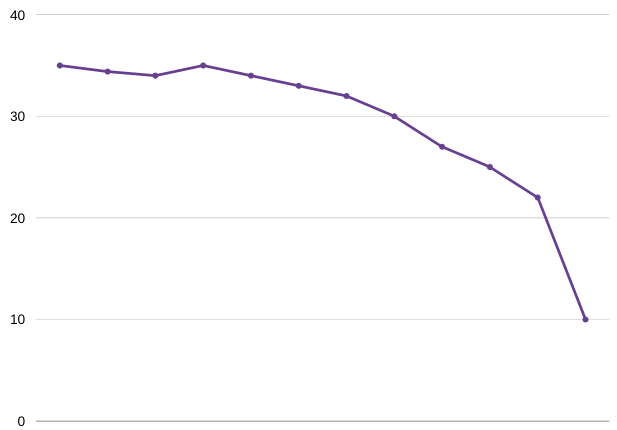
pyplot.plot(recall, precision, marker='.', label='Logistic')
# axis labels
pyplot.xlabel('Recall')
pyplot.ylabel('Precision')
pyplot.show()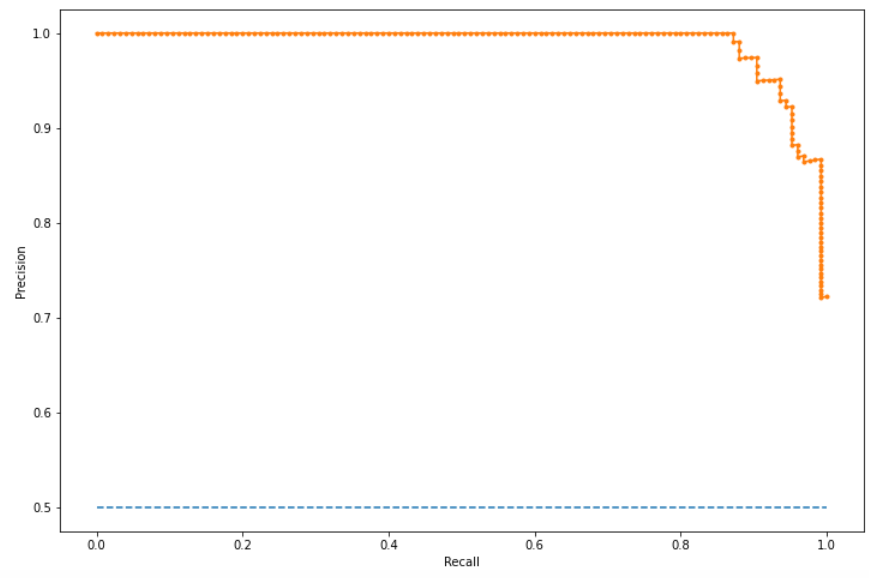
Calculate threshold value using precision and recall which will lead to best possible classification model.
# convert to f score
fscore = (2 * precision * recall) / (precision + recall)

# locate the index of the largest f score
ix = argmax(fscore)
print('Best Threshold=%f, F-Score=%.3f' % (thresholds[ix], fscore[ix]))

# plot the roc curve for the model
no_skill = len(testy[testy==1]) / len(testy)
pyplot.figure(figsize=(12,8))
pyplot.plot([0,1], [no_skill,no_skill], linestyle='--', label='No Skill')
pyplot.plot(recall, precision, marker='.', label='Logistic')
pyplot.scatter(recall[ix], precision[ix], marker='o', color='black', label='Best')

# axis labels
pyplot.xlabel('Recall')
pyplot.ylabel('Precision')
pyplot.legend(loc=3)

# show the plot
pyplot.show()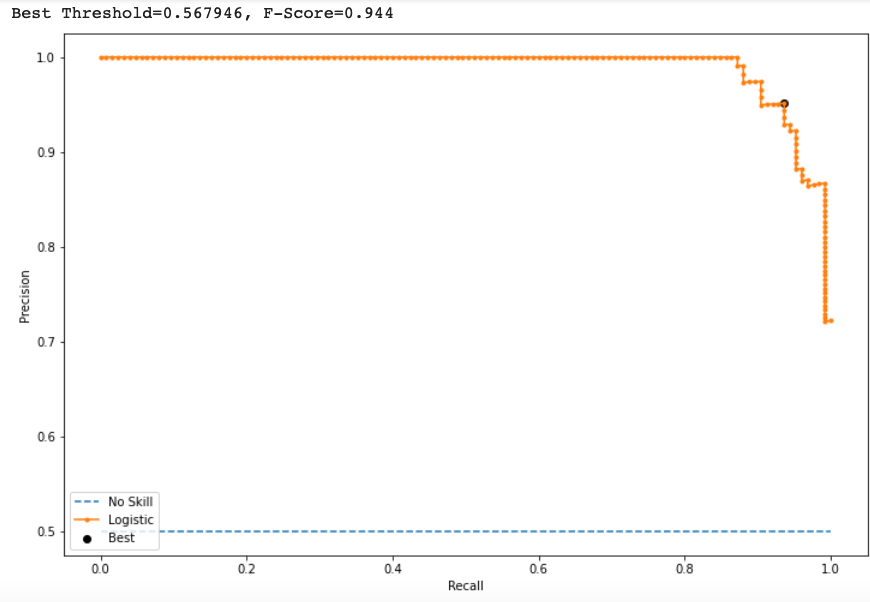
It shows at Threshold = 0.567946, F-score is maximum which means the best suited threshold value for this binary prediction is 0.56.
Summary
In this reading you learn about theoretical concept behind Precision & Recall curve and How maximum F-score represents the maximum accuracy for a model. Along with it you went through certain model performance analysis concepts – True Positive Rate and False Positive Rate.
In the previous reading you can go through ROC-AUC curve understanding. Good Luck. Keep Exploring.